If you run a subscription-based business, understanding subscription metrics is non-negotiable. These metrics are the key performance indicators (KPIs) that show how your business is performing, what’s working, and where you need to improve. From tracking customer acquisition costs to analyzing churn rates, these numbers tell the story of your business, helping guide data-driven decisions and setting you up for success.
Which subscription metrics are the most important? Let’s break them down so you can focus on the right metrics to grow your subscription business.
Why Are Subscription Metrics Important?
Whether you run a subscription app or a subscription service, these numbers provide real-time insight into your business’s health. They reveal how your marketing efforts are paying off, how satisfied your users are, and how well your customer retention strategies are performing.
By monitoring the right metrics, you can:
- Enhance the customer experience and improve customer loyalty.
- Identify weak spots in your business model and fix them before they become bigger issues.
- Optimize marketing costs to acquire more qualified leads.
Subscription metrics also make it easier to forecast revenue and plan for sustainable growth. Without them, it’s like driving a car without a dashboard—you’re operating blind.
Core Subscription Metrics Every Business Should Track
Let’s cover the specific subscription metrics that matter most, why they’re important, and how to calculate them.
1. Churn Rate
The customer churn rate is the percentage of subscribers who cancel their subscription within a given period.
Churn rate directly impacts your monthly recurring revenue (MRR) and total revenue. A high churn rate means you’re losing active subscriptions, which is a red flag for customer satisfaction and retention strategies.
Example: If your subscription app has 1,000 users and 100 cancel in a month, your churn rate is 10%. High churn rates can indicate issues with your customer experience or pricing strategy.
2. Retention Rate
Customer retention or renewal rate is the percentage of subscribers who continue their subscription over a given period.
It basically tells you the likelihood an average customer will re-sign the contract.
Anything above 80% shows you have above-average customer renewal, which signals strong customer loyalty and a great user experience.
Example: If 900 out of 1,000 users renew their subscription each month, your retention rate is 90%. Improving this rate can dramatically boost annual recurring revenue (ARR).
3. Average Revenue Per User (ARPU)
ARPC is the average revenue a company generates per customer on a monthly basis, or yearly, depending on which you choose to use.
Average Revenue Per User helps you understand the profitability of your subscription service.
Example: If your total revenue is $50,000 from 1,000 subscribers, your ARPU is $50. Increasing ARPU could involve upselling or adding value to your product offerings.
4. Customer Acquisition Cost (CAC)
Customer acquisition cost represents the average monetary cost of attracting a new customer. In other words, it’s how much money you spend on marketing and sales to bring in new subscribers.
The trickiest part of calculating CAC is probably figuring out what costs should be included in sales and marketing costs. You have to take into account ad spending, employee salaries, publishing costs, and other expenditures, many of which people don’t consider including.
Knowing your CAC helps you understand whether your marketing efforts are cost-effective. If CAC is higher than the customer lifetime value (CLV), your business model might not be sustainable.
Example: If you spend $10,000 on ads and acquire 100 subscribers, your CAC is $100. A low CAC means you’re attracting new subscribers efficiently.
5. Trial Conversion Rate
The trial conversion rate is the percentage of customers that have converted from a trial period to a paid subscription.
In most cases, this refers to customers who have switched from a free trial to a paid version of your product or service subscription. This metric shows how well your subscription model is attracting potential customers and converting them into long-term users.
Example: If 500 out of 1,000 trial users sign up for a paid subscription, your trial conversion rate is 50%. Improving this rate can significantly increase your paid subscription numbers.
6. Customer Lifetime Value (CLV)
Customer lifetime value is the average amount of revenue a customer gives your business over the course of their relationship with your company.
It’s a key subscription metric to monitor and attempt to improve. CLV helps you determine how much you should spend on customer acquisition strategies and customer support.
Example: If the average customer spends $500 before canceling, your CLV is $500. Higher CLV means more profitable customers.
7. Monthly Recurring Revenue (MRR)
MRR is the total monthly revenue from all active subscriptions.
Tracking your monthly recurring revenue (MRR) helps you understand, among other things, the financial health of your company.
Plus, if you record it every month, you can use the month-to-month fluctuations and overall trend in MRR to assess business performance and predict future growth.
8. Annual Recurring Revenue (ARR)
Annual recurring revenue is your total contractually obligated revenue over the course of a year. It’s the annual revenue your company expects to repeatedly bring in.
Subscription-based companies track this metric to form an even broader view of their company’s financial health and future revenue growth than would be possible with just MRR.
Both MRR and ARR provide a clear picture of financial stability and growth potential.
Example: A subscription business with an MRR of $100,000 and ARR of $1.2 million can forecast growth and allocate resources effectively.
Advanced Metrics for Long-Term Success
Beyond the basics, there are advanced metrics that subscription companies should monitor to ensure long-term growth.
Net Promoter Score (NPS)
Measures how likely your users are to recommend your service to others.
Why It Matters: A high NPS reflects strong customer loyalty and satisfaction.
Gross Margin
The difference between revenue and the cost of providing your subscription service.
Why It Matters: A higher gross margin means your subscription model is more profitable.
How to Leverage Metrics for Growth
Once you’ve identified the right metrics to track, it’s time to use them to optimize your business.
- Enhance the User Experience: Use real-time insight from metrics like NPS to improve the customer journey.
- Focus on Retention: Reducing churn and boosting retention rate is more cost-effective than constantly acquiring new customers.
- Improve Conversion Rates: Optimize your free trial to paid subscription pipeline to attract more qualified leads.
Simplify Recurring Billing and Metric Tracking
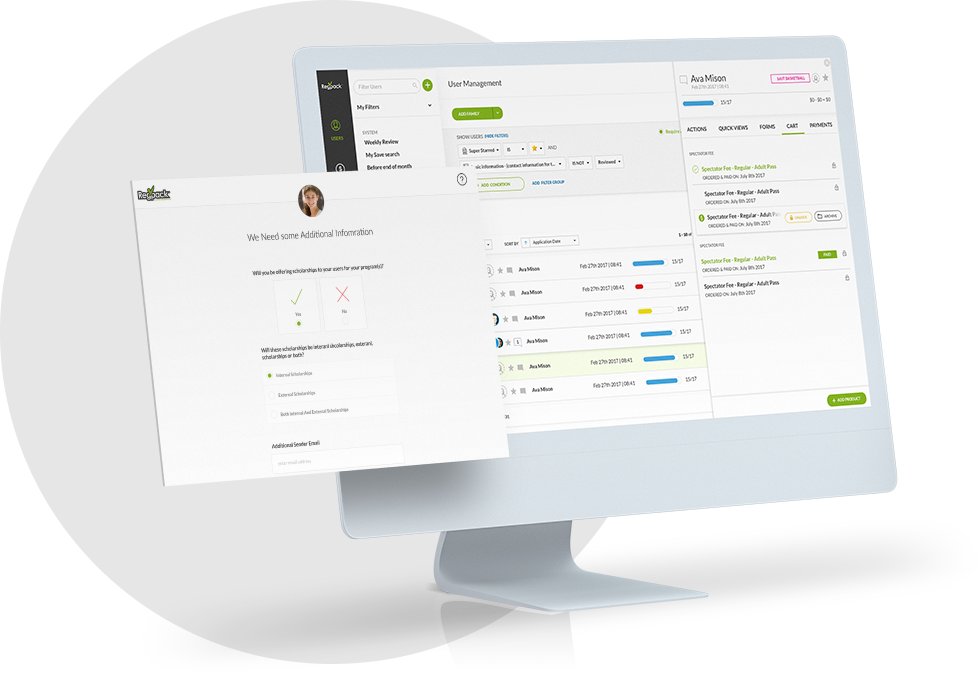
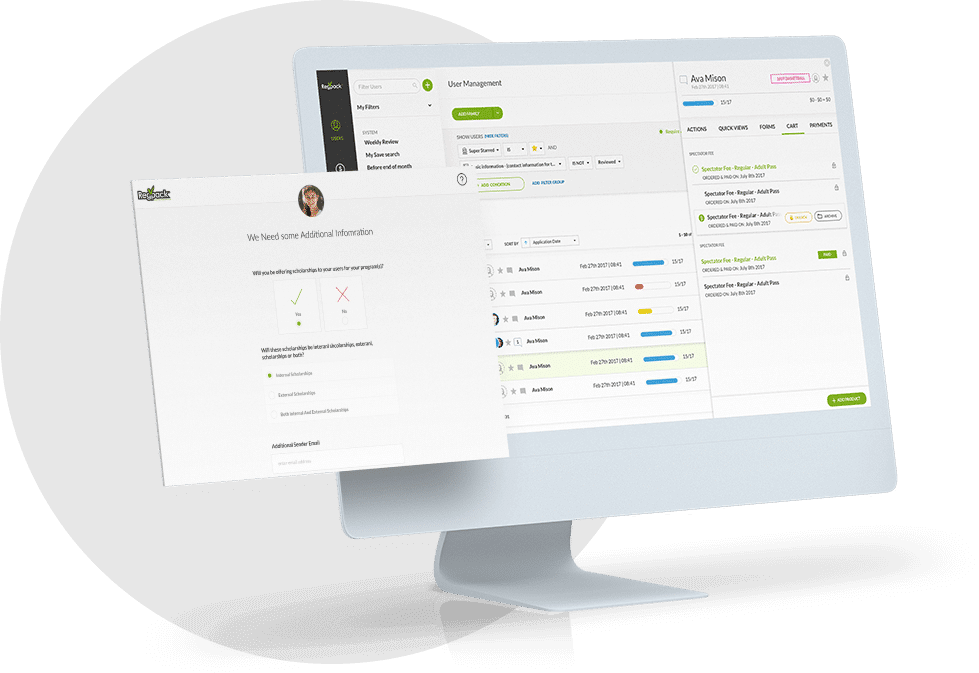
Regpack isn’t just for subscriptions—it’s a versatile platform designed to simplify recurring billing and payment processes. Whether your business involves memberships, programs, or ongoing services, Regpack gives you the tools to handle recurring payments efficiently while providing valuable insights into your revenue metrics.
With features like automated billing, flexible payment plans, and detailed reporting, Regpack supports you in growing your business.
Own Your Business Growth with Smarter Billing
Equip your business with tools to manage recurring billing, track essential metrics, and make data-driven decisions that drive growth.


