

Using financial reports, small business professionals can reveal truths about their business that enable them to make more informed decisions and create effective strategies for growth.
The information acquired that way allows them to avoid cash flow issues and other hurdles known to plague small businesses.
In this article, we’ll cover the ins and outs of the seven most important financial reports for small businesses, from cash flow statements to weekly sales reports.
Having a good grasp on them will ensure that you’re in control of your business’s operations, future, and money.
- Cash Flow Statement
- Income Statement
- Balance Sheet
- Accounts Receivable Aging Report
- Accounts Payable Aging Report
- Budget vs. Actual Report
- Weekly Sales Report
- Conclusion
Cash Flow Statement
A cash flow tells you how cash is leaving and coming into your business.
Alongside the income statement and balance sheet, it is one of the three most important financial reports for small businesses.
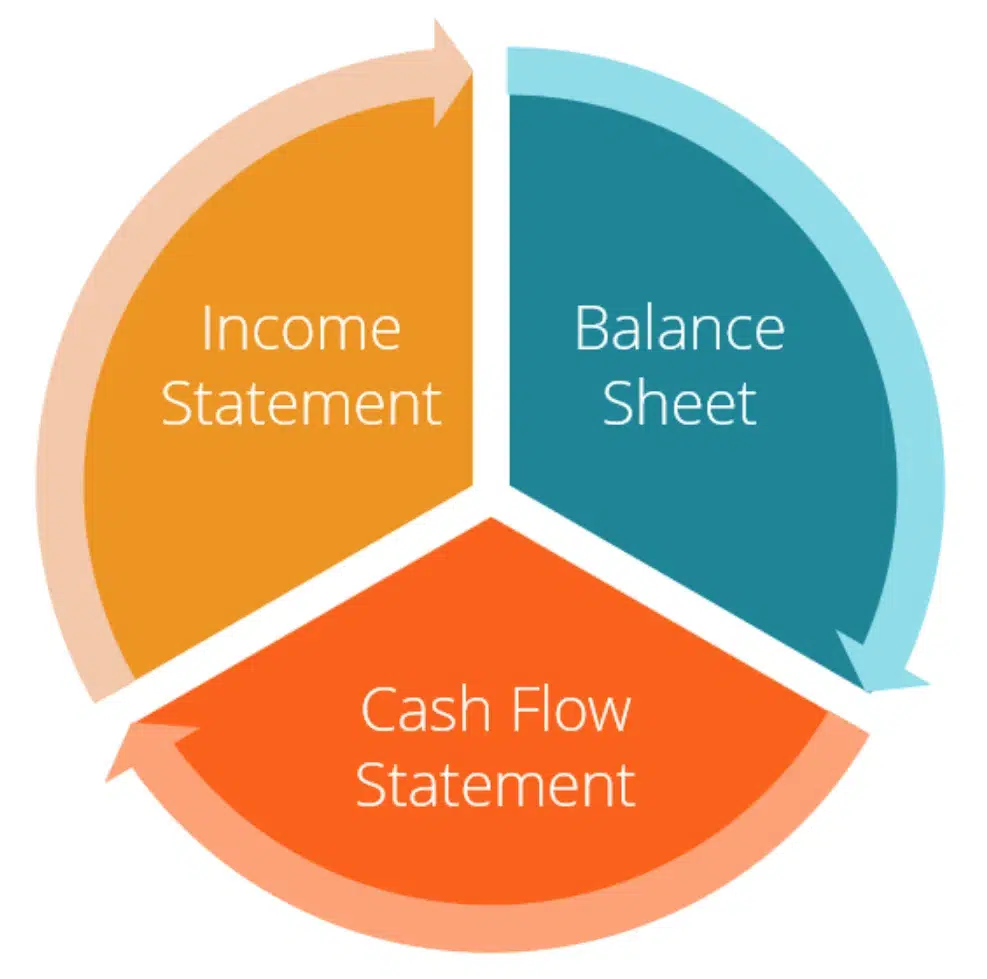
Source: Corporate Finance Institute
It helps billing teams and business owners ensure that they have enough cash to maintain their current operations.
It also enables them to predict future cash flow and plan operations accordingly.
For instance, if they were planning to hire five new sales reps but noticed that cash flow is likely to take a serious dip over the next six months, they may have to hold off on the expansion.
The clarity provided by a cash flow statement makes it, according to databox’s survey, the most important metric for small businesses to track:
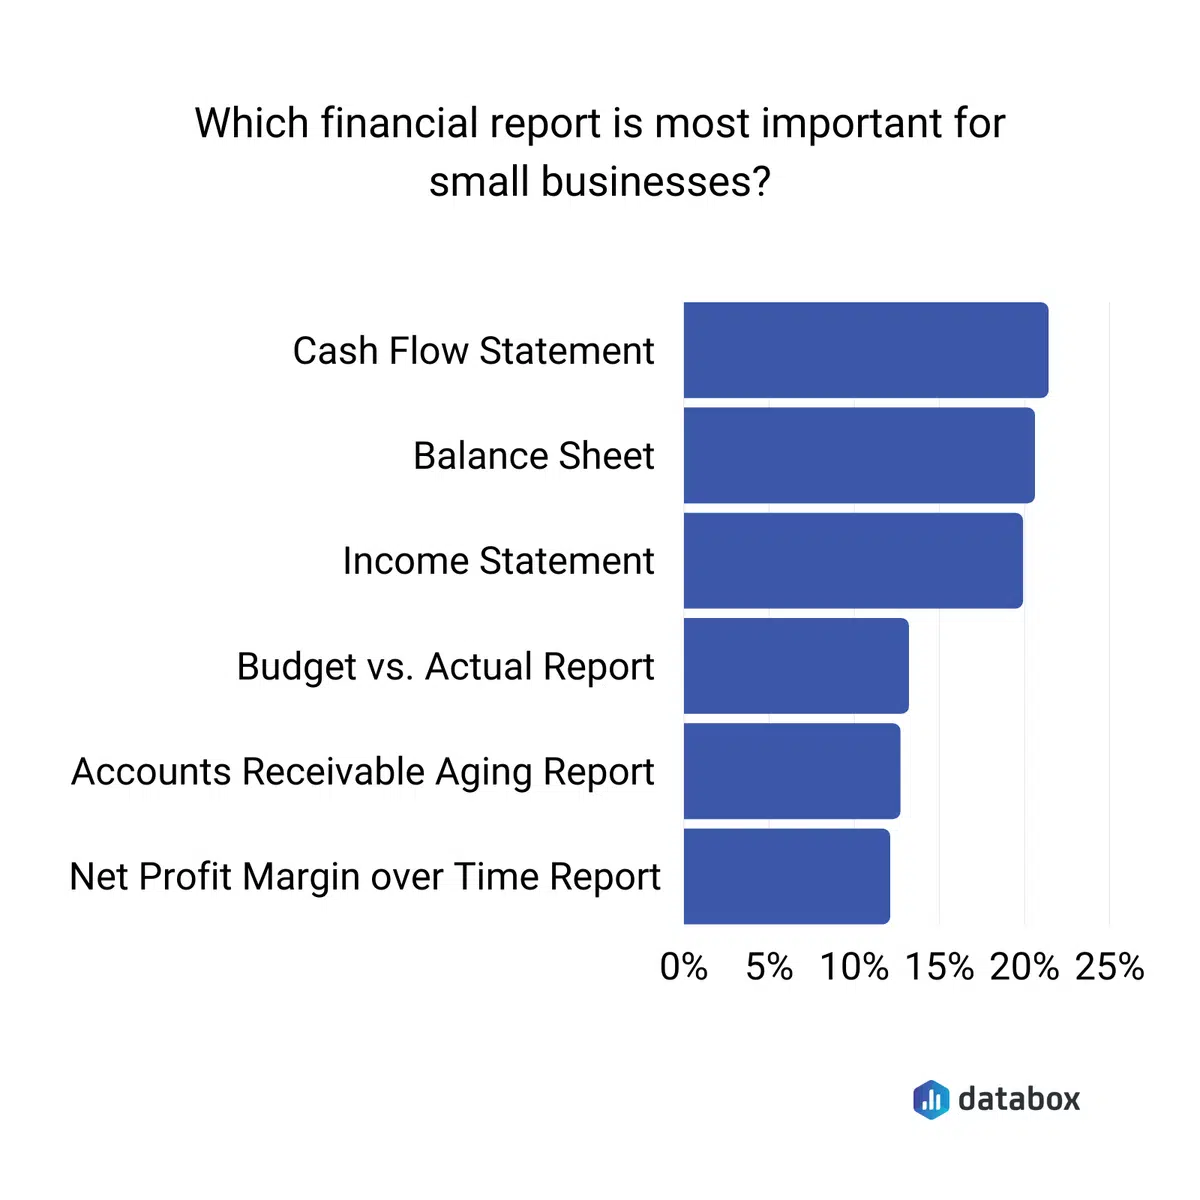
Source: Databox
The cash flow statement differs from the income statement and balance sheet in that it takes into account only transactions and related activities conducted in cash or cash equivalents.
Credit purchases or charges, for example, aren’t represented in the statement.
That’s because businesses can’t easily fund operations with non-cash assets. They can’t pay their electricity bill with accounts receivable.
The statement is concerned with liquid assets so it can inform businesses on what they can and can’t afford to do in the near future.
As you’ll see in the cash flow statement example below, the statement is divided into four main sections.
The first three are cash flows from operations, investing, and finance activities, whereas the last is the net increase (or decrease) of cash during the year.
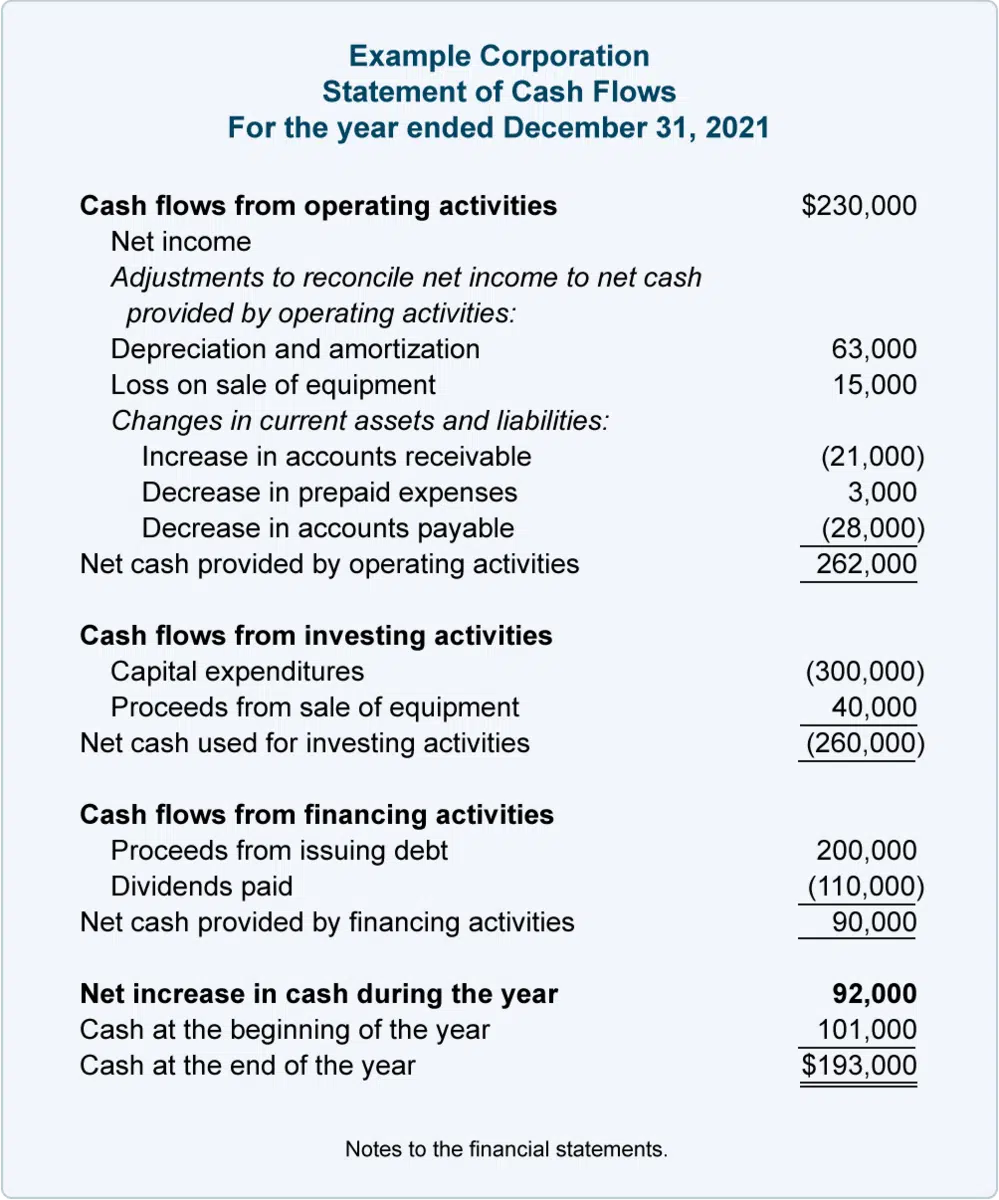
Source: Accounting Coach
Note that the numbers in parentheses denote instances of cash outflow, such as purchasing capital or paying dividends, while the numbers without parentheses are inflows.
The company was able to increase its cash by $92,000 over the last year.
This can be a good thing. It can indicate your business’s growth is sustainable.
Perhaps it means operations have become more efficient and less costly, or they’ve collected a lot of overdue invoices that were sitting in AR.
But, an increase in cash isn’t always a good thing.
For example, a company could take out a loan to save itself from going under, thereby increasing the available cash, but only in relatively short terms.
You’ll have to perform a more rigorous cash flow analysis to uncover the meaning behind the numbers.
Usually, small businesses will create a cash flow statement every month, allowing them to easily spot cash flow trends over longer stretches of time and assure their operations are sustainable.

Accept Payments Online, Right On Your Website!
Streamline your checkout process, offer payment plans, and more!
Income Statement
The income statement, also known as a profit and loss statement, tells you the profitability of your business over a period of time, written as a net profit or loss.
The statement takes into account total revenues and expenses over the given period to give an overview of a business’s financial performance.
Below is an example of an income statement:
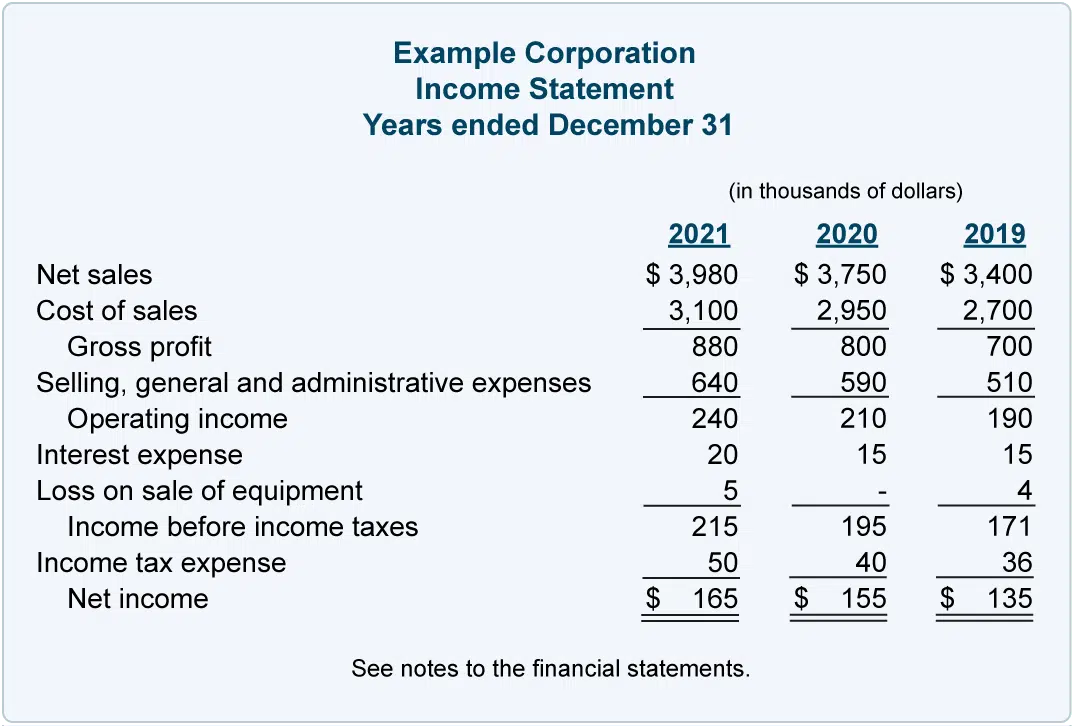
Source: Accounting Coach
In the example above, the company has been profitable three years in a row. You can see this by looking at the “Net income” section in the last row.
This is a good sign for most companies, especially established ones.
However, some newer businesses might operate at a loss for strategic reasons, for instance, to ensure more rapid growth.
Airbnb, for instance, is still not profitable, likely because they reinvest what they earn to fuel that growth.
The goal for all companies, however, should be to become profitable.
As for who uses it, the income statement is most valuable to internal stakeholders, such as members of the board, and external ones, such as investors or creditors.
It helps them evaluate the financial stability of a small business or the risk of investing in it.
It’s also helpful for billing teams and management.
Typically, small businesses run an income statement report quarterly and annually to monitor the profitability and spot areas where expenses are too high or earnings too low, so that they can make adjustments.
Balance Sheet
Finishing off the triad of the most crucial small business financial reports is the balance sheet, which tells you your business’s current assets, liabilities, and shareholder equity at a certain time.
In other words, it tells you what your business owes and owns.
Take a look at this example of a balance sheet:
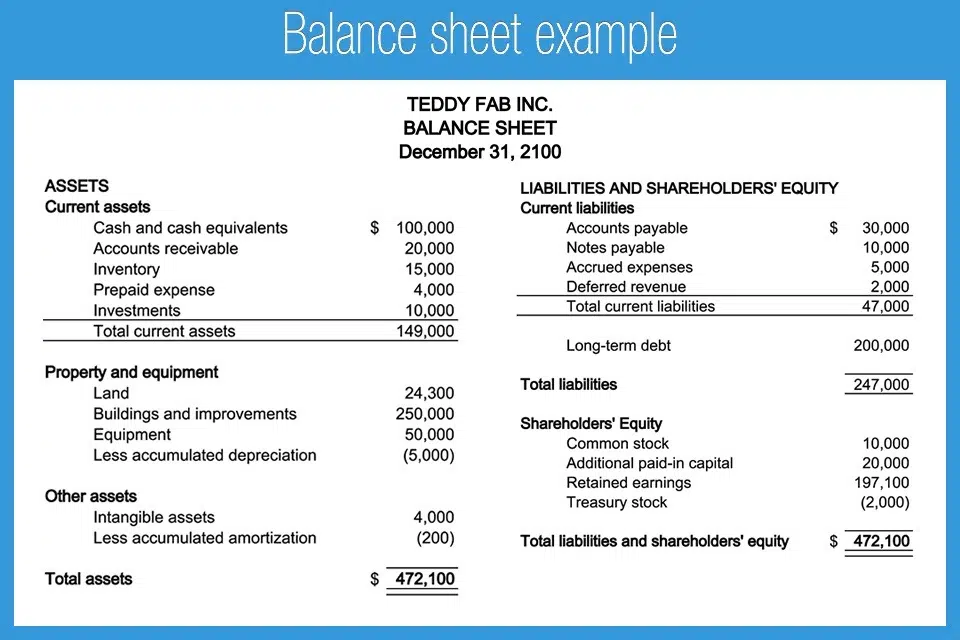
Source: Freshbooks
As you can see, the balance sheet is split into two sides: assets and liabilities on the one hand, and shareholders’ equity on the other.
Both sides should be equal, as is the case in the example above.
The balance sheet is crucial for those looking to receive credit from lenders, as those lenders will use it to determine your creditworthiness, which affects the interest rates on your loans or other extensions of credit, as well as their likelihood to invest.
Like with most financial reports, the deep, most valuable information comes after the balance sheet analysis.
The main method used in this case is the financial ratio analysis, where you use formulas to gain insight into your business’s financial and operational health.
For example, you can compare the balance sheet to the income statement to measure the efficiency of your business’s asset usage.
And you can use the debt-to-equity ratio to see how well the business is able to hit its debt obligations, and therefore, the risk of investing.
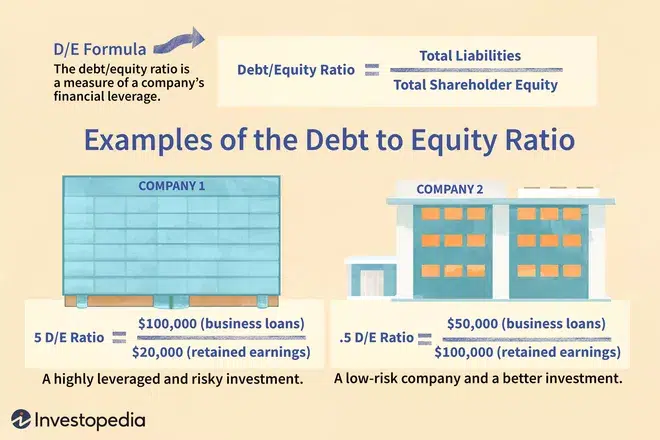
Source: Investopedia
Above, you’ll note that company #2 has a lower debt to equity ratio, and will therefore have an easier time paying its debts off, which qualifies it as a low-risk investment.
Overall, the balance sheet is one of the most vital financial reports small business accountants and owners need to generate on a routine basis.
Decrease Non-Payment By 75%
With Flexible Payment Plans!
Accounts Receivable Aging Report
The accounts receivable (AR) aging report tells you how much money your clients owe your business, and in which month you can expect to receive the payments.
A perusal of this report enables you to predict cash flow and plan your business operations and expenditures accordingly.
For example, in the report below, the company knows they can expect to bring in $25,000 in the next month, from client XYZ Ltd:
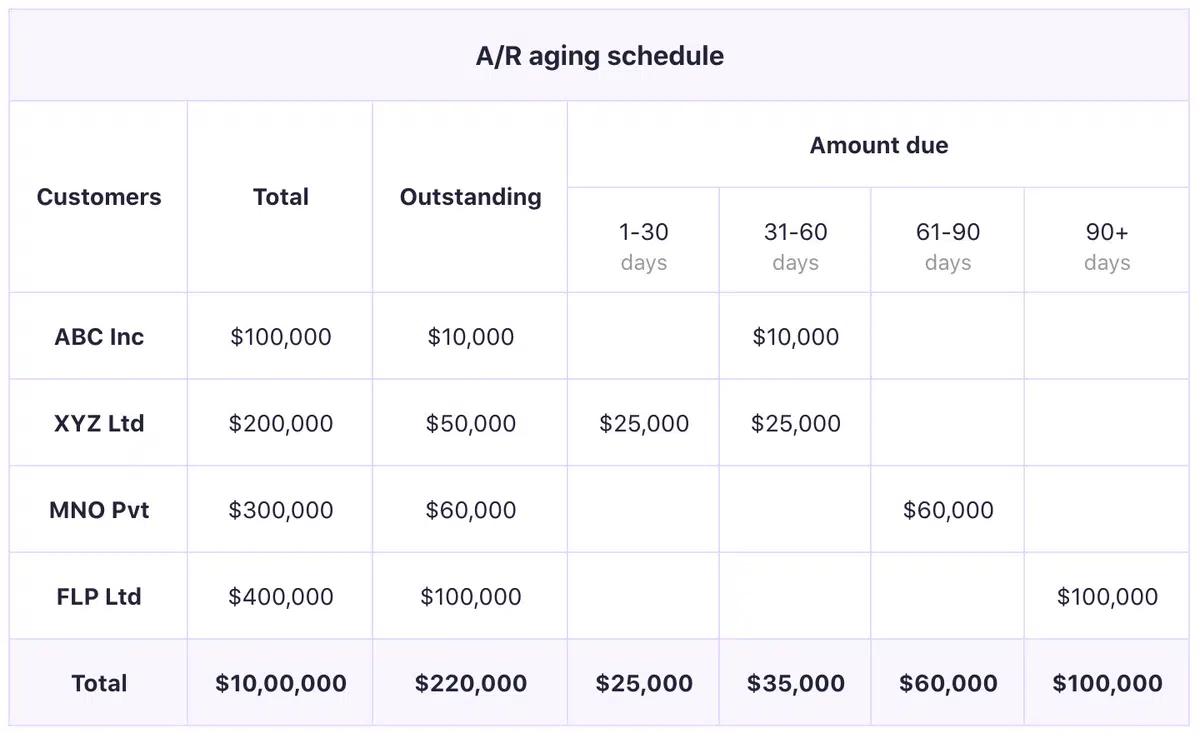
Source: Chargebee
Consistently producing this report should be a part of a robust accounts receivable management process, which should also include tracking payments, conducting collections, and even establishing a customer credit rating.
While it is possible to generate an AR aging report and handle some of these other tasks manually, most small businesses choose to automate accounts receivable management using billing software platforms, since it saves them time and reduces human error.
Regpack’s online payments software is one such tool popular amongst small business owners, as it allows them to easily track their AR, send automated invoices online, and run insightful reports on invoice history and payment activity.
In sum, a small business with a finger on the pulse of its accounts receivable will collect money faster and avoid cash flow problems down the line, and the AR aging report is one of the many tools deployed to make this awareness possible.
Accounts Payable Aging Report
Accounts payable (AP) is a term denoting the money that you owe to vendors or suppliers.
The AP aging report tells you which amounts you owe to whom and in which time frames. Typically, accounts are payable in thirty-day periods.
Knowing how much they have to pay this month, next month, and so on, gives small business owners the knowledge to ensure they have enough cash on hand during these time frames to pay their vendors.
For example, if a business owner was considering investing in a new piece of equipment the following month, but then saw that the AP total for that month was so high that it made it impossible to afford paying its vendors and buying the equipment, they would wait until later to make the purchase, or somehow increase cash flow as soon as possible.
Below is an accounts payable aging report example, with amounts due categorized by monthly buckets:
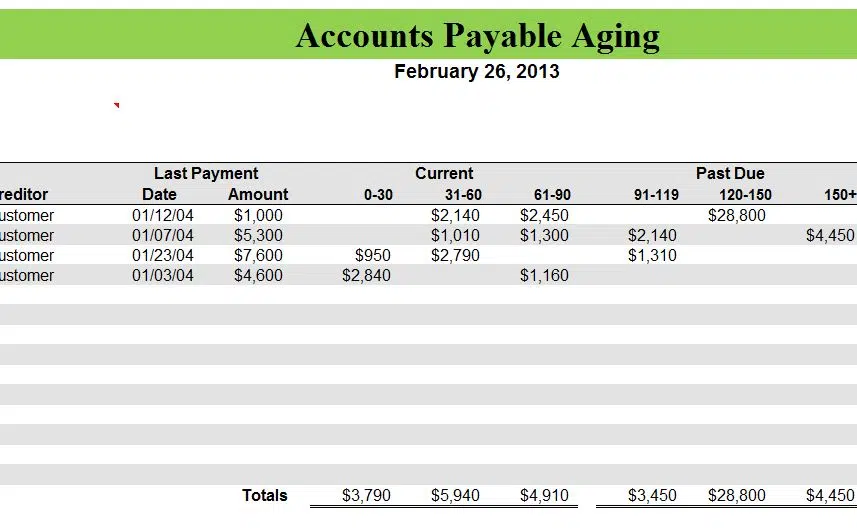
Source: My Excel Templates
The bottom row gives a quick summary of the total payments due within each month, and also shares information about which payments are overdue and therefore take priority.
More than anything, the accounts payable aging report helps small businesses avoid cash flow issues caused by ignorance about upcoming cash outflows.
In light of the fact that 82% of small businesses fail because of misunderstanding or mismanagement of cash flow, this point is not one to neglect.
Budget vs. Actual Report
If only we small business owners were all able to always stick to our budgets. Unfortunately, the unpredictabilities of life make that an ideal rather than a reality.
Unexpected expenses and earnings pop up, and we are forced to stray from our original financial plan.
That’s not all bad, as long as you are keeping track of the discrepancies and try to consistently keep them to a minimum by improving your budgeting skills.
The budget vs. actual report compares your expected expenditures and revenues to what you actually paid and earned, over a period of time (often a month).
This report tells you how closely your business stuck to the budget for each category, as shown below:
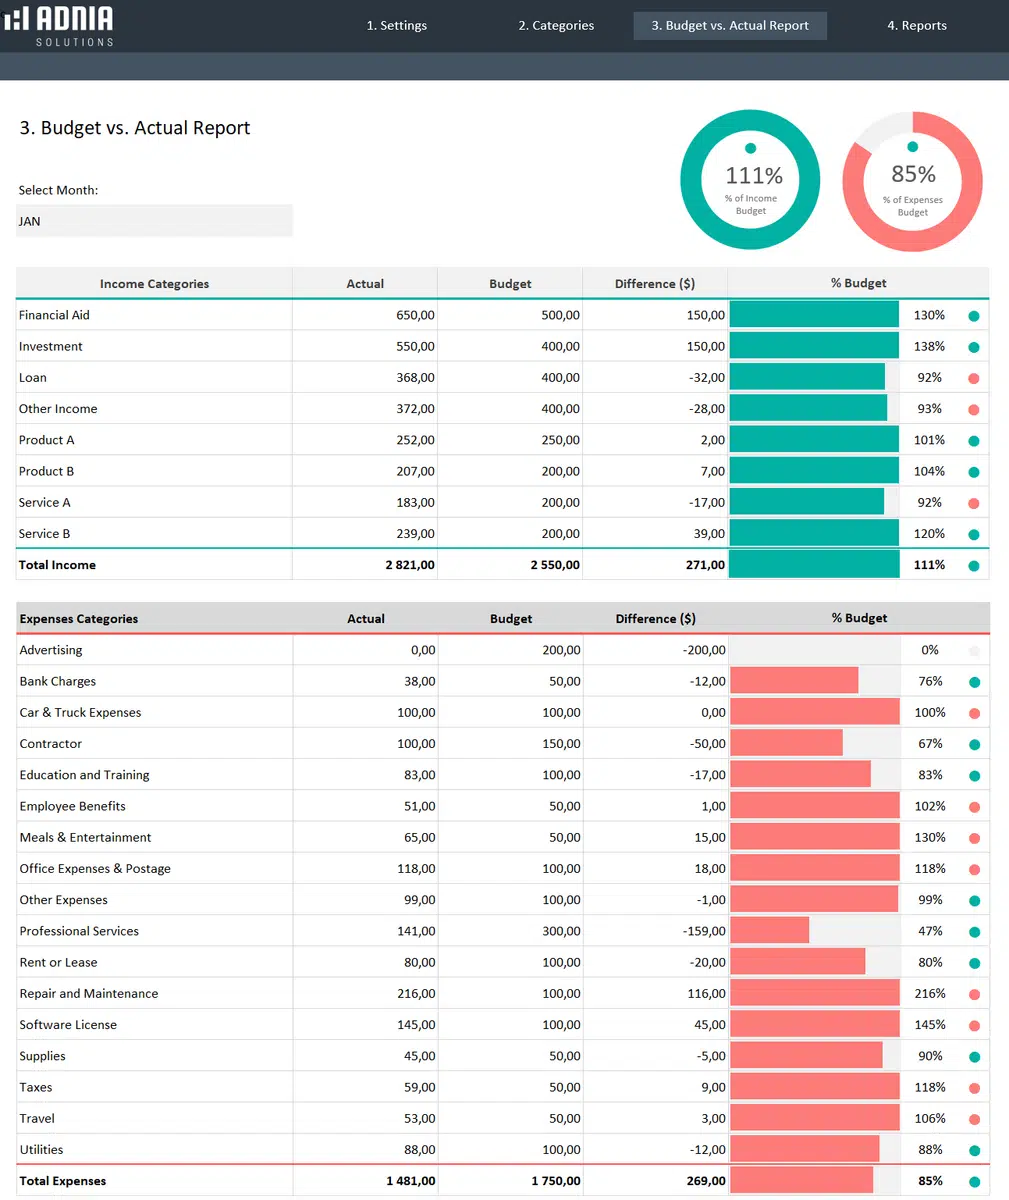
In this example, the company earned more than it expected, and spent less overall — a pleasant surprise.
Using a report like this, you can easily see the difference between expected and reality, and then figure out why your initial budget was off, or why you failed to stick to it, so you can do better next time around.
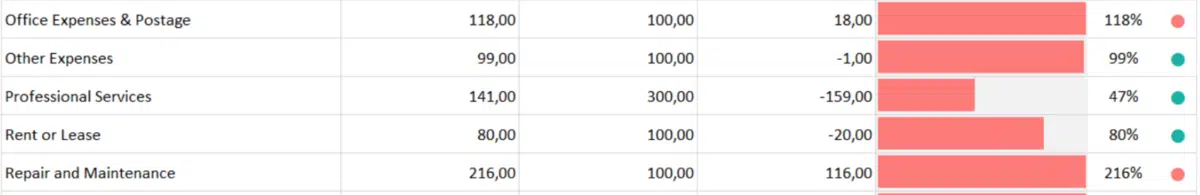
The first step when analyzing the report is to find the most significant deviations. For instance, perhaps your team spent a lot more on repair and maintenance than you expected.
Next month, you might choose to increase this category and remove some dollars from a category where you spent less than intended, like professional services in the example below:
You can also dig into the why behind the difference in expected vs. actual numbers, which can help you better understand your business and customers.
If transportation was high, maybe it’s because your clients are further away than you’d anticipated, and they prefer in-person meetings.
In that case, the business owner might want to find a more cost-effective way of getting their salespeople around.
As an added personal benefit, running this report on a monthly basis and taking time to read it closely will make you a better planner in the long run.
You’ll also start to notice improvements in your powers of intuition and estimation concerning your business’s financials.
Don’t Limit Your Customer Pool!
Offer Multiple Payment Options Seamlessly
Weekly Sales Report
A weekly sales report, often represented on the dashboard of a CRM, gives you an idea of your business’s performance in different sales activities over the last week.
Your sales report should track and display important sales metrics, most importantly your sales KPIs.
Different companies report on different metrics, of course, because they use different sales processes.
For instance, a B2B service-based company might list the total number of consultations held while a small subscription-based business might list trial conversions this week.
Regardless, some of the most common weekly sales metrics in a sales report are the following:
| Meetings set | Number of new meetings scheduled with leads |
| Sales made | The number of sales pushed over the finish line |
| Sales calls | Total number of sales calls made |
| Opportunities created | The number of new sales opportunities opened |
| Revenue generated | Total revenue generated from sales made |
Some less common but still useful fields to include might have to do with sales expenses, such as rooms rented or food and beverage costs for hosting a client, as is the case in this weekly sales report example:
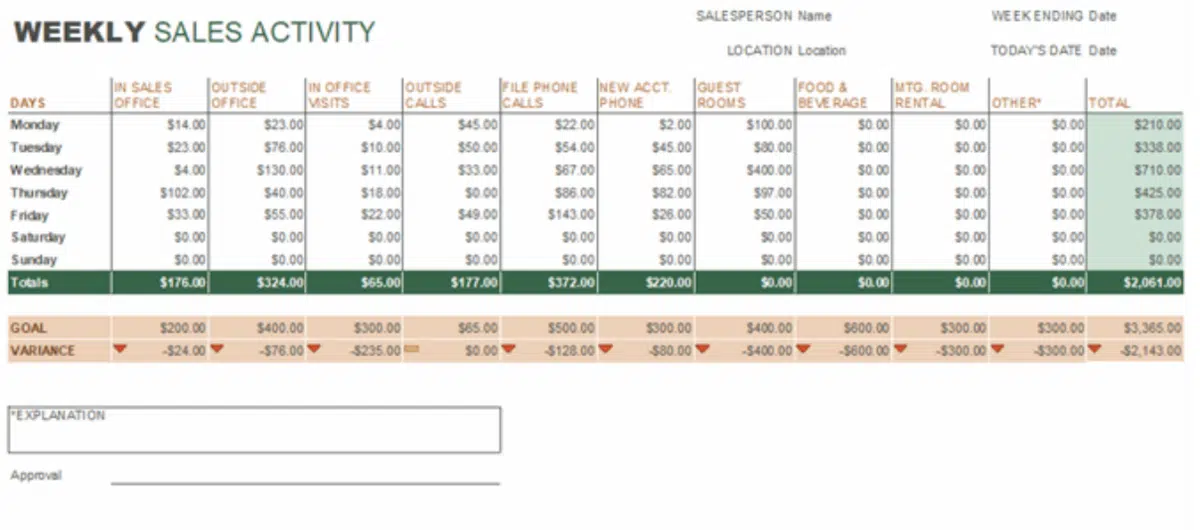
Source: Microsoft
Monitoring your weekly sales numbers with this report and reviewing them during regular team meetings is a great way to stay on track towards your quarterly and annual sales goals.
Conclusion
Running financial reports to stay on top of your business’s cash flow, budgetary fluctuations, sales activities, and other aspects of your small business is imperative for its success.
For the next steps, start with the three most important reports, the income statement, balance sheet, and cash flow statement, and practice your financial analysis skills to uncover truths about your business and clarity on how to move forward towards financial excellence.